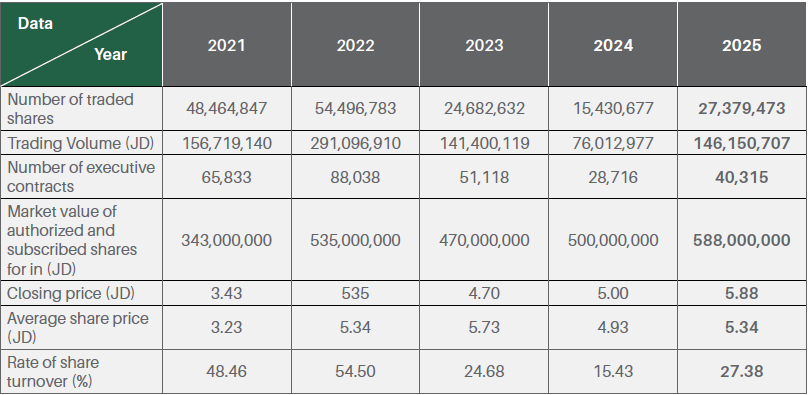
The number of shares transacted during 2023in the stock exchange amounted to (27,379,473) shares valued at JD (146,150,707) executed through (40,315) transfer contracts at an average price of JD (5,34) for each share.
The following table shows the activity movement of the Company's shares in the Stock Exchange from 2021 to 2025:
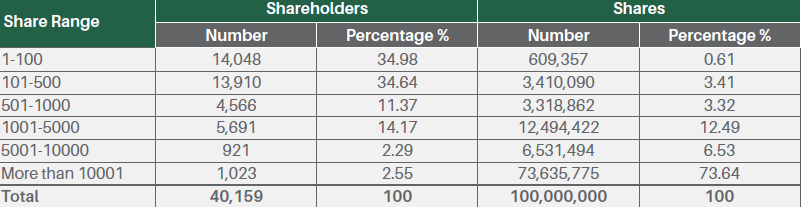
The following table shows the number of shareholders according to the share slides they own, as of December 31, 2025
The following table shows the development of the percentage of cash dividends distributed to shareholders for the last five years from 2019to 2022and recommended to be distributed for the year 2023:
The following table shows the net profits and Cash dividends and shareholders’ Equity for the last five years 2019-2023: